The Psychology of Design
A look at how designers can leverage psychology to build more intuitive, human-centered products and experiences.
This article was originally published on UX Collective.
An interesting thing happens when we recollect a past event. Instead of considering the entire duration of the experience, we tend to focus on an emotional peak and the end, regardless of whether they were positive or negative. In other words, we remember our life experiences as a series of representative snapshots rather than a comprehensive timeline of events. Our feelings during the most emotionally intense moments and at the end are averaged in our minds and heavily influence how we assess the overall experience to determine if we’d be willing to do it again or recommend it to others. This observation, known as the peak–end rule, strongly suggests we should pay close attention to these critical moments to ensure users evaluate an overall experience positively.
We’ll start with taking a look at the origins of the peak-end rule, and the visionary psychologists that identified it.
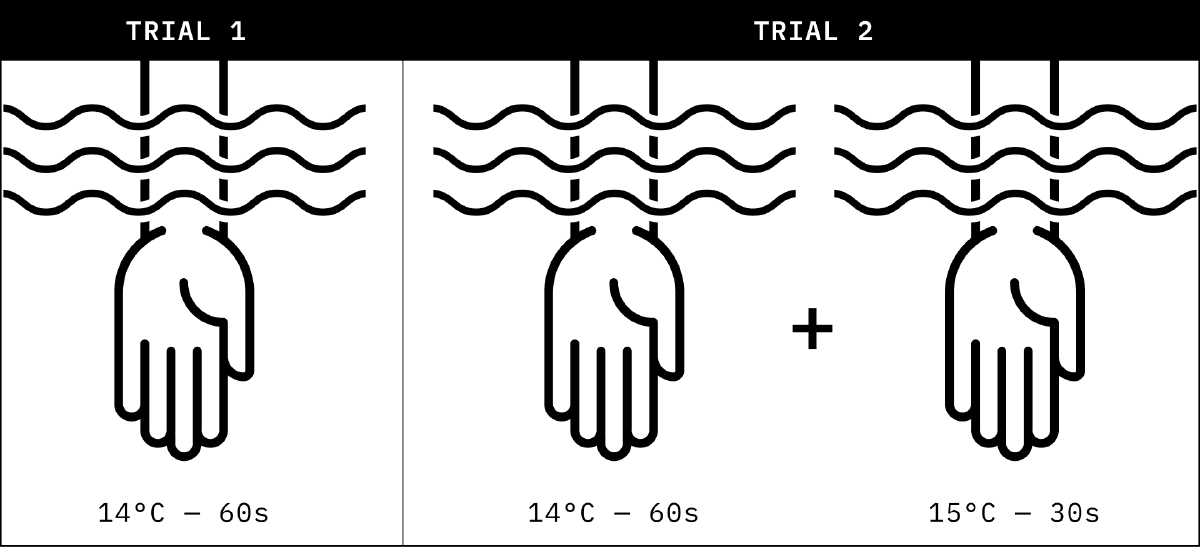
Evidence for the peak–end rule was first explored in the 1993 paper “When More Pain Is Preferred to Less: Adding a Better End” by Daniel Kahneman et al.1 They conducted an experiment in which participants were subjected to two different versions of a single unpleasant experience (Figure 1). The first trial involved participants submerging a hand in 14 °C water for 60 seconds. The second trial involved participants submerging the other hand in 14 °C water for 60 seconds, then keeping it submerged for an additional 30 seconds as the water was warmed to 15 °C. When given the choice of which experience they would repeat, participants were more willing to repeat the second trial, despite it being a longer exposure to the uncomfortable water temperatures. The conclusion by the authors was that the participants chose the longer trial simply because they preferred the memory of it in comparison to the first trial.
Subsequent studies would corroborate this conclusion, beginning with a 1996 study by Kahneman and Redelmeier2 which found that colonoscopy or lithotripsy patients consistently evaluated the discomfort of their experience based on the intensity of pain at the worst and final moments, regardless of length or variation in intensity of pain within the procedure.
A later study by the same researchers3 expanded on this by randomly dividing patients into two groups: one that underwent a typical colonoscopy, and another that underwent the same procedure in addition to having the tip of the scope left in for three extra minutes without inflation or suction. When asked afterward which they preferred, patients who underwent the longer procedure experienced the final moments as less painful, rated their overall experience as less unpleasant, and ranked the procedure as less aversive in comparison to the other participants. Additionally, those that underwent the longer procedure were more likely to return for subsequent procedures — a result of these participants judging the experience positively because of the less painful end.
To understand the peak–end rule, it is helpful to have an understanding of cognitive biases. The topic warrants an entire book of its own, but here I’ll just give a brief introduction in the context of the peak–end rule.
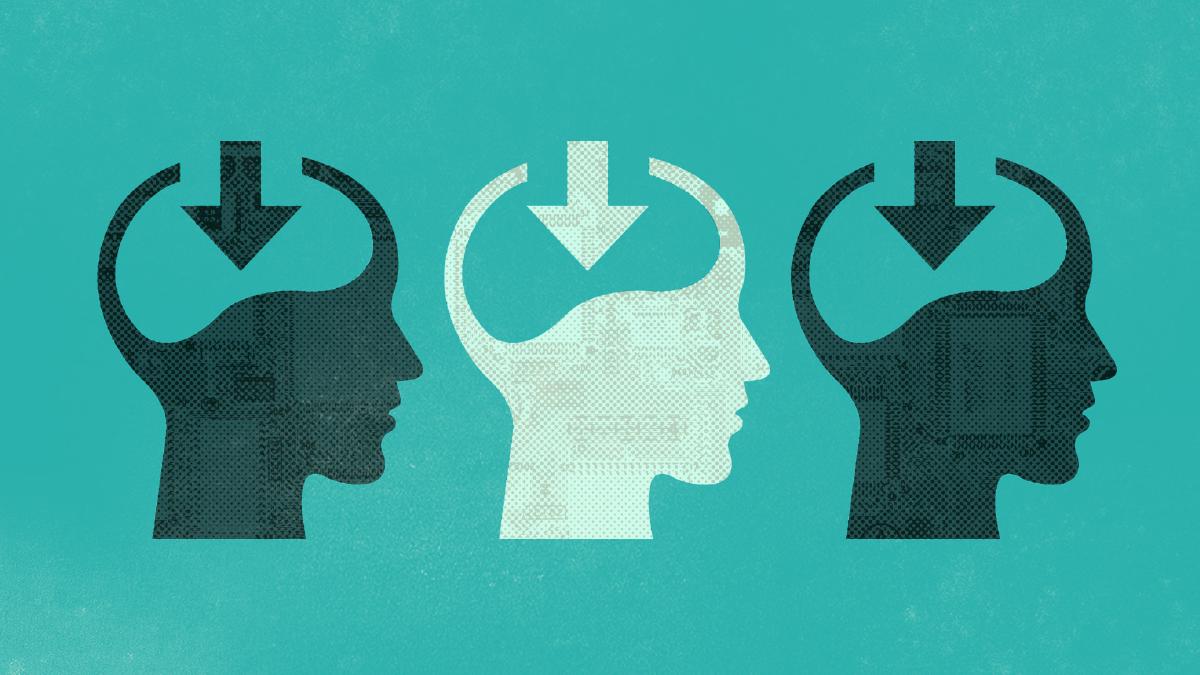
Cognitive biases are systematic errors of thinking or rationality in judgment that influence our perception of the world and our decision-making ability. First introduced by Amos Tversky and Daniel Kahneman in 1972,4 these mental shortcuts increase our efficiency by enabling us to make quick decisions without the need to thoroughly analyze a situation. Instead of constantly becoming paralyzed by the process of mental examination every time we must make a decision, we can rely on these unconscious automatic responses to help expedite things, only engaging in heavier mental processing when necessary. However, cognitive biases can also distort our thinking and perception, ultimately leading to inaccurate judgment and poor decisions.
Perhaps you’ve tried to have a logical discussion about a polarizing hot-button issue with someone else, only to discover it was incredibly difficult. The underlying reason for this can quite often be attributed to the fact that we attempt to preserve our existing beliefs by paying attention to information that confirms those beliefs and discounting information that challenges them. This is known as confirmation bias: a bias of belief in which people tend to seek out, interpret, and recall information in a way that confirms their preconceived notions and ideas. This is but one of many common biases humans are susceptible to on a daily basis.
The peak–end rule, also a cognitive bias, is known as a memory bias because it impairs the recall of a memory. We remember intensely emotional events more than less emotional events, and this has an effect on how we perceive an experience: we recall not the sum of how we felt throughout the experience but the average of how we felt during the peak emotional moments and at its end.
The peak-end rule is related to another cognitive bias known as the recency effect, which states that items near the end of a sequence are the easiest to recall.
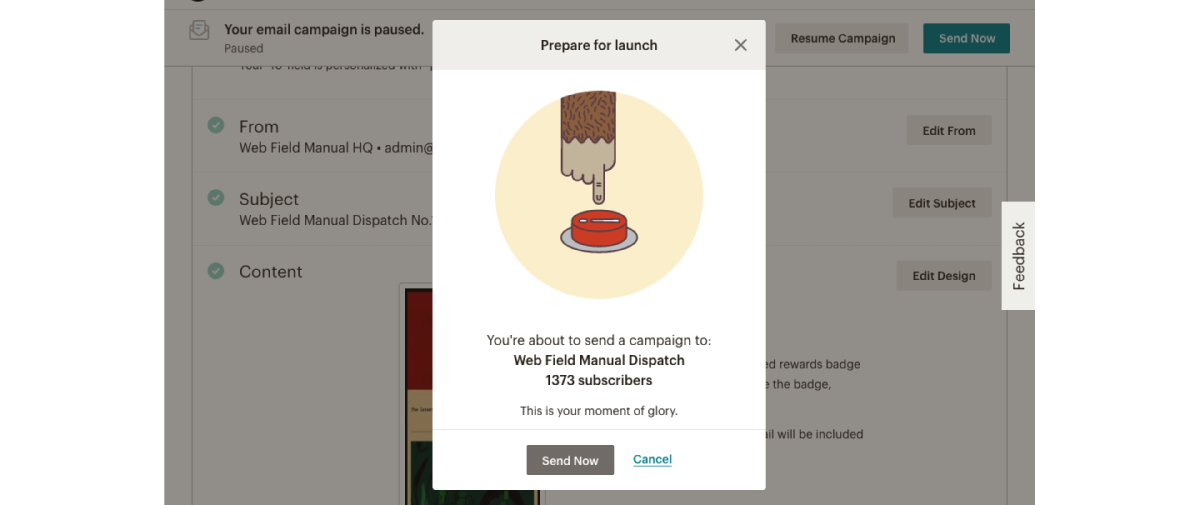
One company that demonstrates proficiency in understanding how emotion impacts user experience is Mailchimp. The process of creating an email campaign can be quite stressful, but Mailchimp knows how to guide users while keeping the overall tone light and reassuring. Take for example the moment when you’re about to hit Send on an email you’ve crafted for your audience’s inboxes. This emotional peak moment represents the accumulation of all the work that has gone into that email campaign, compounded by the potential fear of failure. Mailchimp understands this is an important moment, especially for first-time users, so it goes beyond presenting a simple confirmation modal (Figure 2). By infusing a touch of brand character through illustration, subtle animation, and humor, the tool defuses what could potentially be a stressful moment. Freddie, the company’s emblematic chimp mascot, hovers his finger over a large red button as if to imply he is eagerly awaiting your permission. The longer you wait, the more nervous Freddie seems to get, which is evident through the beads of sweat that appear on his hand and subtle shaking.
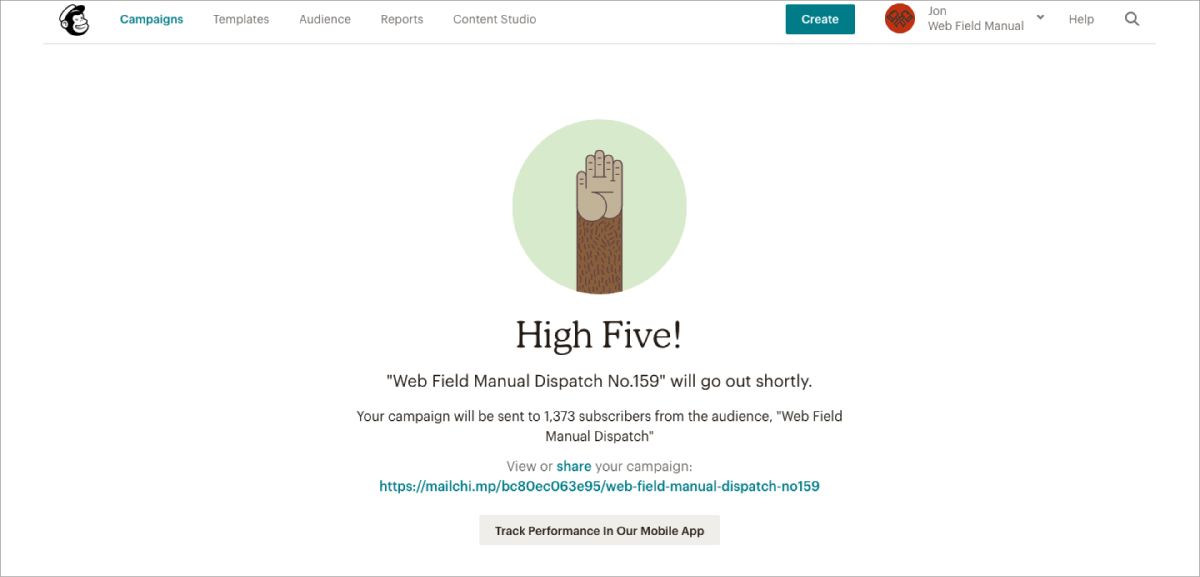
Mailchimp’s artful capitalization on key moments doesn’t end there. Once the email campaign is sent, users are redirected to a confirmation screen (Figure 3) providing details pertaining to the campaign. There’s also an Easter egg on this screen that validates the user’s hard work: Freddie gives them a high five, as if to reassure them of a job well done. These details reinforce the feeling of accomplishment and enhance the experience, creating positive mental snapshots for people that use this service.
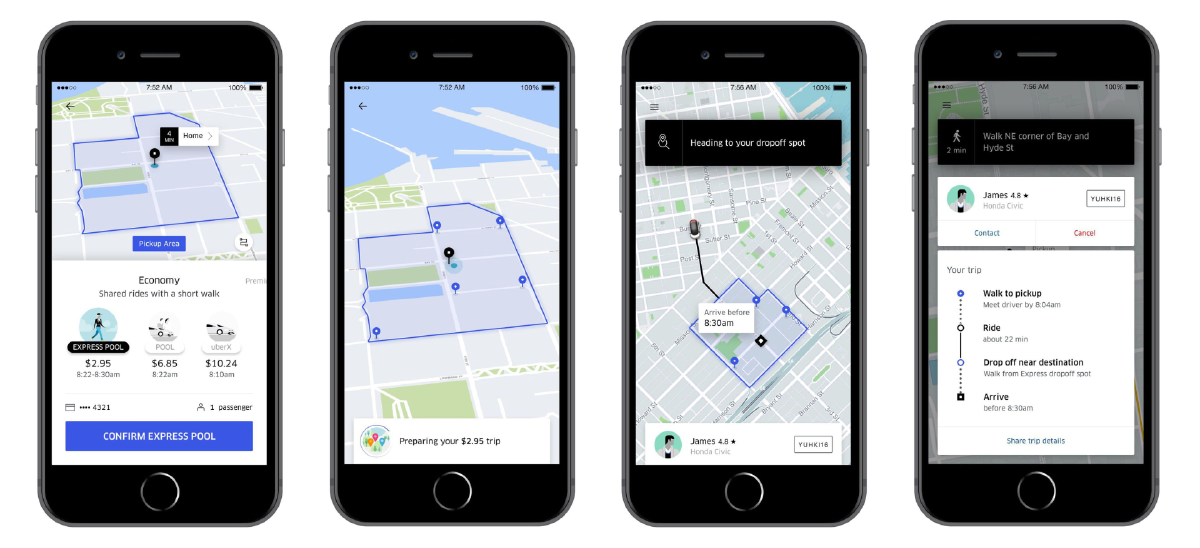
Positive events aren’t the only things that have an impact on how people feel about a product or service. Negative events also provide emotional peaks and can contribute to a user’s lasting impression of an experience. Take for example wait times, which can have a profound effect on how people perceive a product or service. Ride-sharing company Uber realized that waiting was an unavoidable part of its business model, and sought to reduce this pain point by focusing on three concepts related to wait time: idleness aversion, operational transparency, and the goal gradient effect.5 Uber Express POOL customers (Figure 4) are presented with an animation that helps to keep them not only informed but also entertained (idleness aversion). The app provides an estimated time of arrival and information on how arrival times are calculated (operational transparency). It clearly explains each step of the process so customers feel that they are continuously making progress toward their goal of getting a ride (goal gradient effect). By focusing on people’s perceptions of time and waiting, Uber was able to reduce its post-request cancellation rate and avoid what could easily become a negative emotional peak while using their service.
One handy tool for identifying the emotional peaks of end users throughout an experience is journey mapping. This qualitative exercise is invaluable for visualizing how people use a product or service through the narrative of accomplishing a specific task or goal. Journey mapping results in the creation of a design artifact (Figure 5) that not only helps designers and project stakeholders align to a common mental model, but also creates a deeper shared understanding of the customer experience and aids in identifying the challenges and opportunities present within an experience.
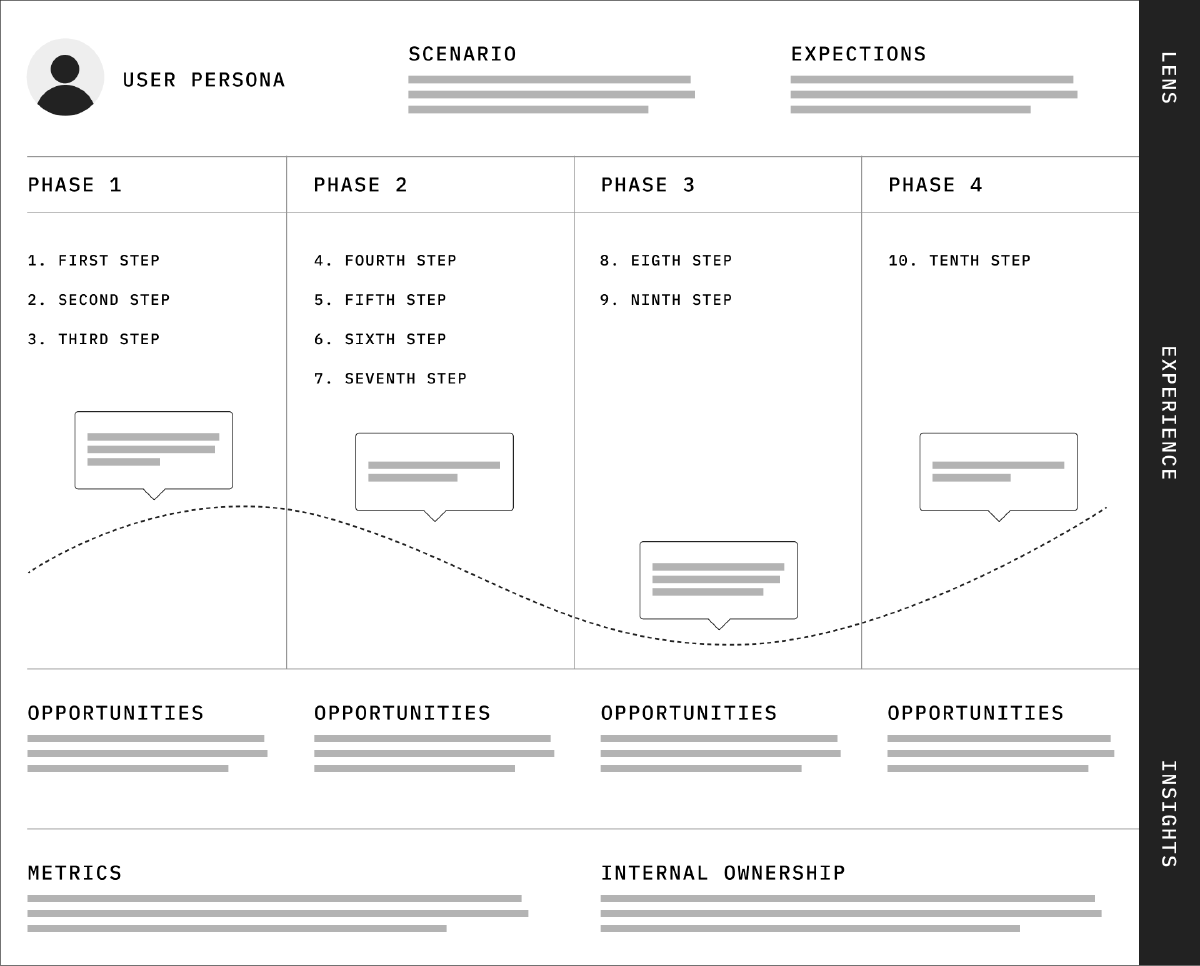
Like all design exercises, journey maps can and should be tailored to the purposes and goals of the project. That being said, they’ll usually contain some key information:
The lens of a journey map establishes the perspective of the person the experience represents. It usually will contain the persona of the end user, which should be predefined based on research on the target audience of the product or service. The lens should capture the specific scenario that the journey map is focused on. This scenario may be real, or it can be anticipated in the case of a product or service that hasn’t been launched yet. Finally, the lens usually describes the expectations of the persona in that scenario. For example, Jane (persona) is using a ride-share service app to order a ride (scenario) that she expects to arrive at her exact location in 10 minutes or less (expectation).
The next part of a journey map is the experience section, which illustrates the actions, mindset, and emotions of the end user mapped across a timeline. Starting from the top, the experience is first organized into high-level phases. Next are the actions, which define the steps that the end user must take within each phase to accomplish their task or goal. Following the actions is information pertaining to the mindset of the end user during the experience. This can vary based on what insights the journey map is aiming to uncover; it’s essentially a contextual layer of information that provides a deeper view into what the customer is thinking during each phase.
Typical information captured within this layer includes general thoughts, pain points, questions, or motivations that originate from research and user interviews. Finally there’s the emotional layer, which is usually represented as a continuous line mapped across the entire experience and captures the emotional state of the persona during the experience. This layer is especially significant with regard to the peak-end rule, because it captures the emotional peaks of the customer.
The last part of a journey map is the insights section, which identifies the important takeaways that surface within the experience. This section usually contains a list of possible opportunities to improve the overall experience. It also typically contains a list of metrics associated with improving the experience, and details on the internal ownership of these metrics. Going back to our ride-share example, providing real-time information on the location of the vehicle after the ride is ordered can help reduce the pain point of waiting (opportunity). That feature will need to be designed and developed by the product team (internal ownership) and can be monitored according to post-ride ratings (metric).
It is inevitable that at some point in the lifespan of a product or service something will go wrong. There might be a server failure that has a ripple effect and leads to service outages, or a bug might open up a security vulnerability, or a design decision might be made that fails to consider all customers and leads to some unintended consequences. All of these types of situations can have an emotional effect on the people that use your product, and ultimately inform their overall impression of the experience.
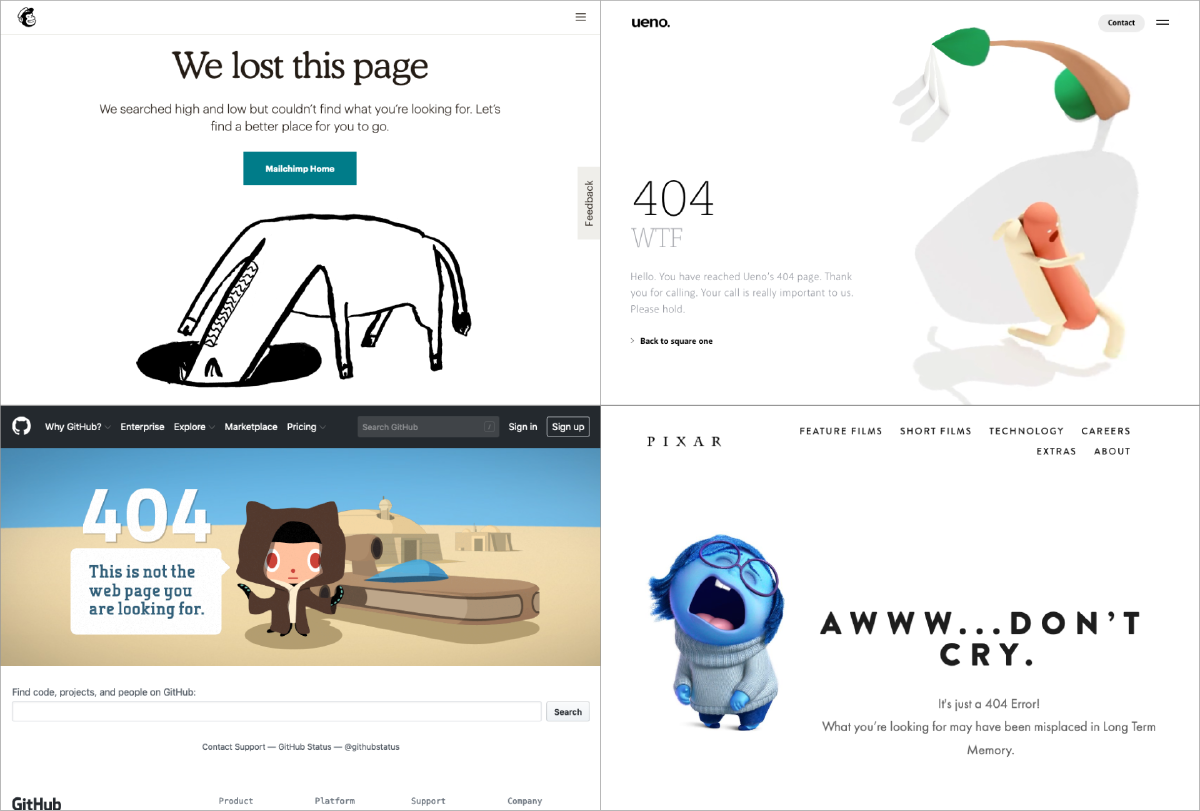
Such setbacks can also be opportunities, however, if the right fallbacks are in place. Take for example the all-too-common 404 error page. When a web page can’t be found users may become frustrated, creating a negative impression. But some companies use this as an opportunity to create a rapport with their customers and enforce their brand personality by leveraging some good old-fashioned humor (Figure 6).
Our memories are rarely a perfectly accurate record of events. How users recall an experience will determine how likely they are to use a product or service again or recommend it to others. Since we judge past experiences not based on how we felt throughout the whole duration of the event but on the average of how we felt at the peak emotional moments and the end, it is vital that these moments make a lasting good impression. By paying close attention to these key moments of an experience, we can ensure users recollect the experience as a whole positively.
Kahneman, Daniel, Barbara L. Fredrickson, Charles A. Schreiber, and Donald A. Redelmeier. 1993. “When More Pain Is Preferred to Less: Adding a Better End.” Psychological Science 4(6): 401–405. ↩︎
Redelmeier, Donald A., and Daniel Kahneman. 1996. “Patients’ Memories of Painful Medical Treatments: Real-Time and Retrospective Evaluations of Two Minimally Invasive Procedures.” Pain 66(1): 3–8. ↩︎
Redelmeier, Donald A., Joel Katz, and Daniel Kahneman. 2003. “Memories of Colonoscopy: A Randomized Trial.” Pain 104(1–2): 187–194. ↩︎
Kahneman, Daniel, and Amos Tversky. 1972. “Subjective Probability: A Judgment of Representativeness.” Cognitive Psychology 3(3): 430–454. ↩︎
Kamat, Priya, and Candice Hogan. 2019. “How Uber Leverages Applied Behavioral Science at Scale.” Uber Engineering blog, January 28, 2019. https://eng.uber.com/applied-behavioral-science-at-scale/. ↩︎
A look at how designers can leverage psychology to build more intuitive, human-centered products and experiences.
A look at both the causes and ways to reduce extraneous mental processing for the user.
How a classic problem-solving principle can help improve our designs.